
Technology & reporting

Live visibility across your people, camp and catering operations.

Ngurra’s purpose-built dashboard gives clients a live view of workforce movements, room allocations, camp resources, inductions, service consumption and food-waste performance.

One operational picture of your site

Remote camps generate information across reception, accommodation, catering, safety and site services. Ngurra brings that information together in one live client dashboard.

Instead of disconnected spreadsheets and retrospective reports, authorised client users get the operational information they need for planning and reconciliation.

People, rooms and roster visibility

Maintain a current record of who is on site, where they are staying and how long they have been on the project.

  • Live Persons On Board count
  • Arrivals and departures
  • Room allocation
  • Company and contractor allocation
  • Roster reconciliation
  • Days continuously on site
  • Visibility to support the client's fatigue-management processes
  • Information to support emergency accountability
Inductions and dietary requirements

Keep essential workforce requirements connected to each person's site record.

  • Induction register
  • Visibility of induction status
  • Dietary restrictions and requirements
  • Dietary information available to the catering team
  • Connection between guest requirements and menu planning

Meals and chargeable items

Capture service consumption and project-chargeable activity against the appropriate guest, company or reporting period.

  • Casual meals
  • Crib and takeaway meals
  • Meals by service period
  • Chargeable and backcharged items
  • Guest and contractor allocation
  • Transparent supporting records
  • Reporting aligned with client reconciliation and billing requirements

Site resources and feedback

Give project teams current visibility of important camp resources and operational feedback.

  • Fuel levels
  • Water levels
  • Waste levels
  • Guest and workforce feedback
  • Operational observations
  • Trends requiring attention
  • Live dashboard visibility

Closed-loop menu improvement

Turning food-waste data into better menus.

Ngurra’s reporting platform connects with our menu-management system to capture kitchen waste and the reasons behind it.

When food is wasted, the team records why: meals not collected, overproduction, a menu item not well received, or product reaching the end of its usable life.

The dashboard links this feedback to the associated CO₂e and water impact, giving our chefs practical information to refine menus and production quantities.

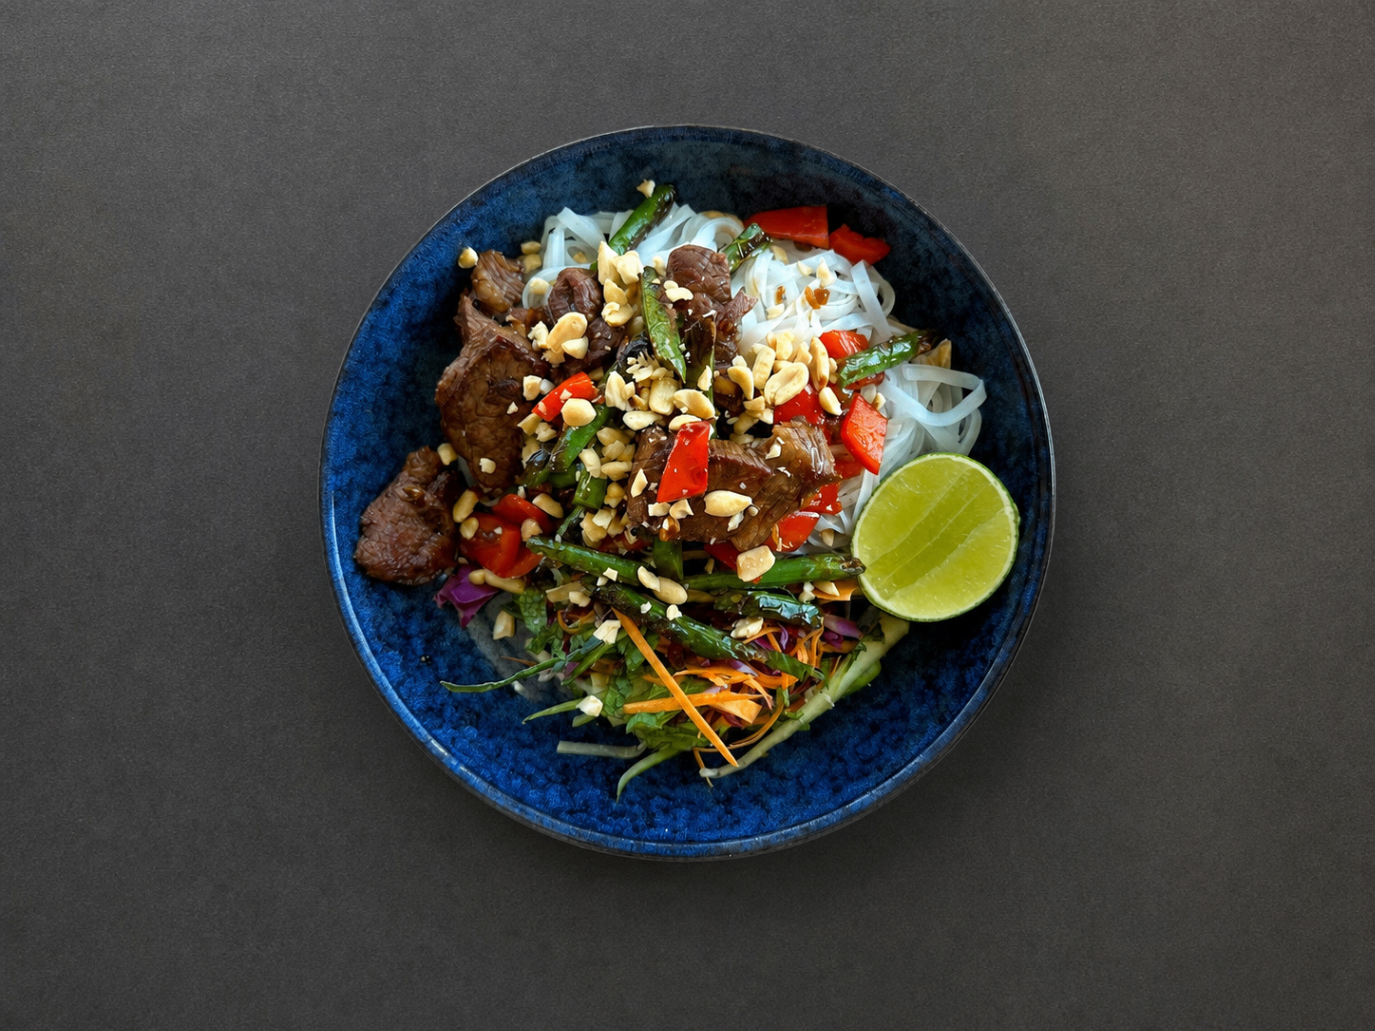
Plated meal prepared in a Ngurra camp kitchen
  1. 01Plan the menu
  2. 02Prepare and serve
  3. 03Record kitchen waste
  4. 04Capture why it was wasted
  5. 05Review CO₂e and water impact
  6. 06Refine future menus and quantities

Live client access

Current information, not just month-end reports.

Clients receive access to a live dashboard that brings together workforce, accommodation, site-resource, commercial and catering information.

Daily operations

  • Current POB
  • Arrivals and departures
  • Room occupancy
  • Days on site
  • Induction register
  • Fuel, water and waste levels

Commercial visibility

  • Casual meals
  • Service consumption
  • Backcharged items
  • Contractor and company allocation
  • Supporting reconciliation information

Food and environmental performance

  • Dietary requirements
  • Menu information
  • Kitchen waste
  • Reasons for waste
  • CO₂e impact
  • Water impact
  • Feedback trends

Dashboard permissions and reporting fields can be configured around the client’s operational and project-control requirements.

Camp operations dashboard

Persons on board

Rooms occupied

Meals served

Kitchen waste by reason

Illustrative dashboard view

Built around the way each project operates.

Ngurra’s platform is purpose-built around remote camp operations. Reporting fields and dashboard views are configured to suit the client and the operating environment.

If a project needs data supplied to an existing ERP or project-control platform, the format is agreed at mobilisation.

Participation reporting

Participation is reported like any other operational metric, live, against an agreed baseline. Workforce composition, regional and Indigenous supplier spend by category, and roles filled against the plan set at mobilisation.

Definitions and frequency are set with you at mobilisation, formatted so the output feeds straight into your own IPP or Local Industry Participation Plan submissions.

Reporting on Remote Meal Packs

Delivery confirmation, consumption against forecast, dietary and allergen compliance, batch traceability and cold chain logs. Smaller scope than a village, same standard of evidence.

See Remote Meal Packs

See how the dashboard would work for your project.

We can walk your operations, HSE, sustainability, procurement or project-controls team through the dashboard and the information it can capture.